These are the exercises to go along with Chapter VI, on the cash flow statement:
- Find the cash flow statement for the company you are interested in.
- Is the company cash positive overall? Which activities are cash flow positive (add to cash flow), and which are cash flow negative (subtract from cash flow)?
- How has free cash flow (FCF) changed over time? Is it usually negative or positive? If FCF is negative but cash flow is positive, what does that tell you?
- Find the FCF as a % of sales metric and see how it has changed over time. Is cash growing more or less rapidly than sales? What does that tell you?
- Do the trends you see in the cash flow information let you know this is a strong, thriving company or do they tend to make you realize the company might be weaker than its earnings trends might indicate?
Here is where you can find all the information you need to complete the exercises.
Find a Company’s Cash Flow Statement
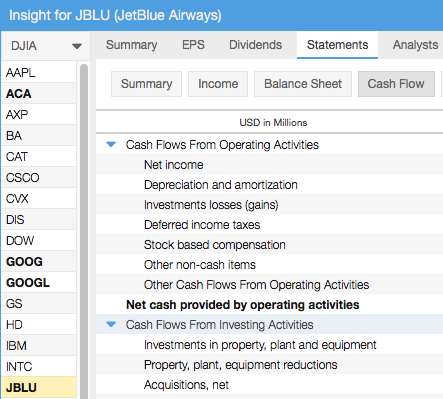
Once you have selected a stock, you will notice that it loads in the table and the Insight panel (on the right hand side of your SR screen). Navigate to the Statements tab and find the Cash Flow Statement among the buttons.
Find a Company’s Income Statement
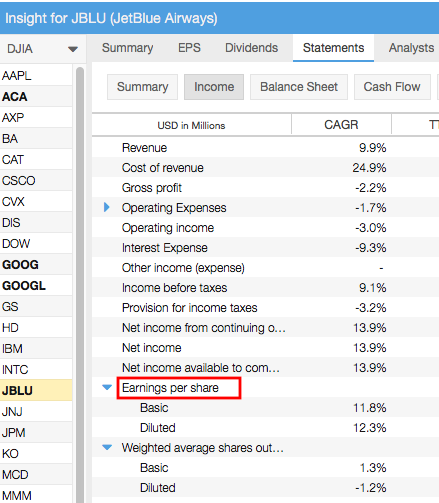
Also in the Statements tab, find the income statement among the buttons. EPS is called out below.
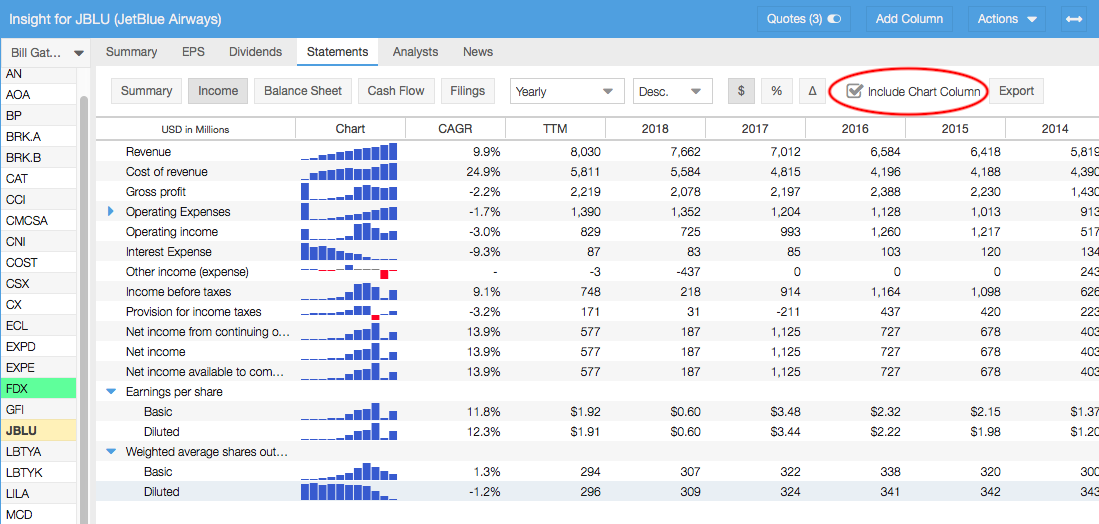
Tip: In the Statements tab, selecting ‘Include Chart Column’ will give you a very quick glance at the overall trend for the metric, as shown below.
Compare Cash Flow and EPS
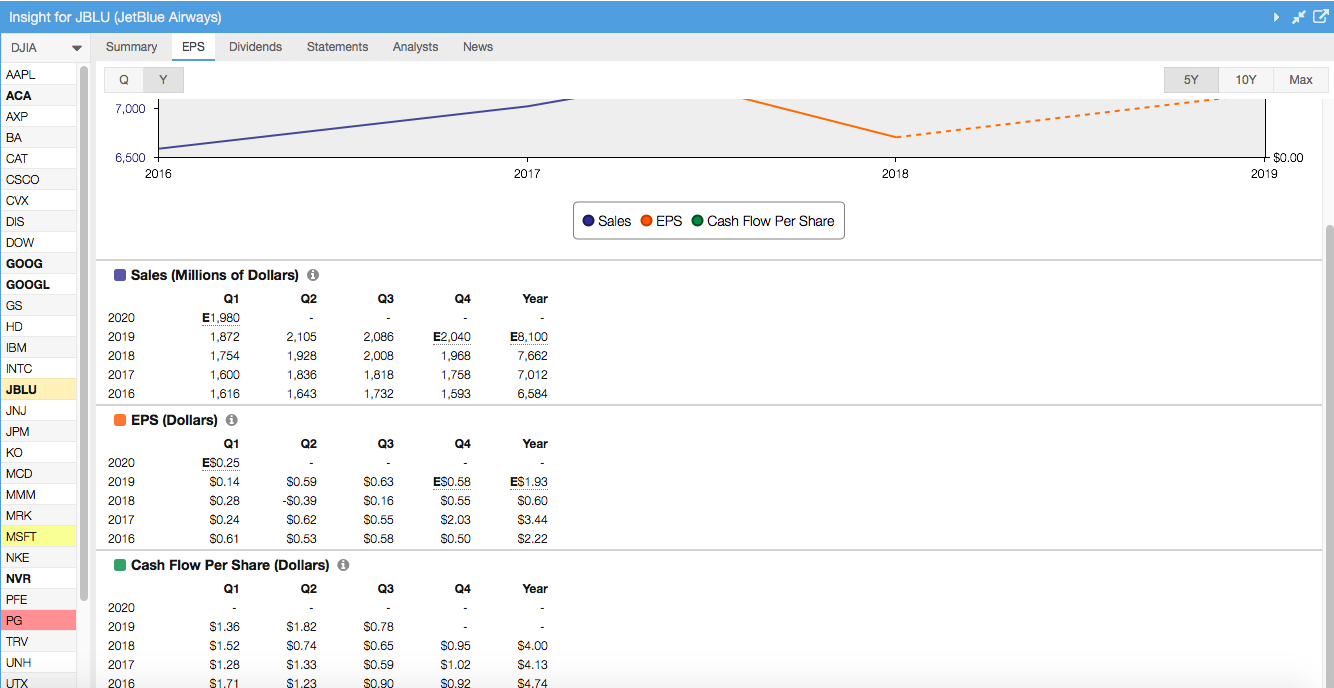
You can also compare sales or EPS to cash flow by opening the EPS tab of the Insight panel for tables of each, like these:
Find Free Cash Flow as a Percent of Sales
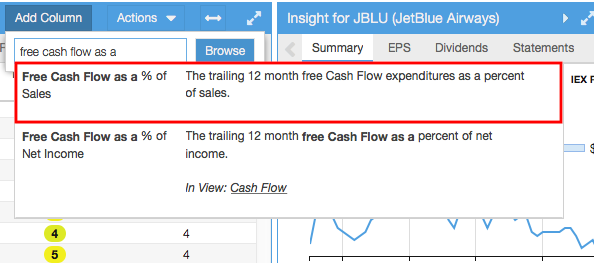
Find this metric by using the “Add Column” button in the table. Simply start typing the metric and wait for it to populate a list of matching names. Add the metric to any view.
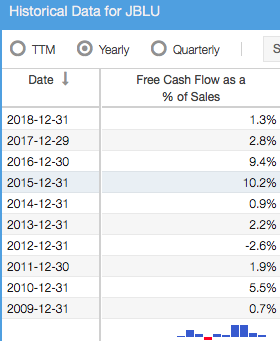
To look at how the value changes over time, right-click on the ticker and select ‘Historical Data’.
For more information on using Stock Rover, see our Help pages or email our Support Team.