Before we dive into financial data and research tips, let’s review a few key investing concepts.
Stock Picking
Stock picking means selecting individual stocks (AKA equities) to go in your portfolio. This is as opposed to buying other types of instruments such as mutual funds or ETFs, which comprise many different stocks. There are many different strategies and theories people use to pick stocks. This guide will not teach you any one strategy, but instead will give you some basic knowledge you need to make independent investment decisions. Much of your own investing process will be guided by your personal goals and interests.
In the following chapters, we will show you the kinds of information you can look at when picking stocks. This includes:
- Financial health
- Earnings growth
- Profitability
- Valuation
- Price performance
As you begin this process, keep in mind that, as with anything, there is an inherent opportunity cost to picking stocks, so as an investor you should aim to minimize that opportunity cost. Not only are you looking for a stock that appreciates, but you also want to find stocks that appreciate more than others. This is why it is important to compare a stock against its peers (other stocks in its industry) and against benchmarks, such as its sector or the S&P 500.
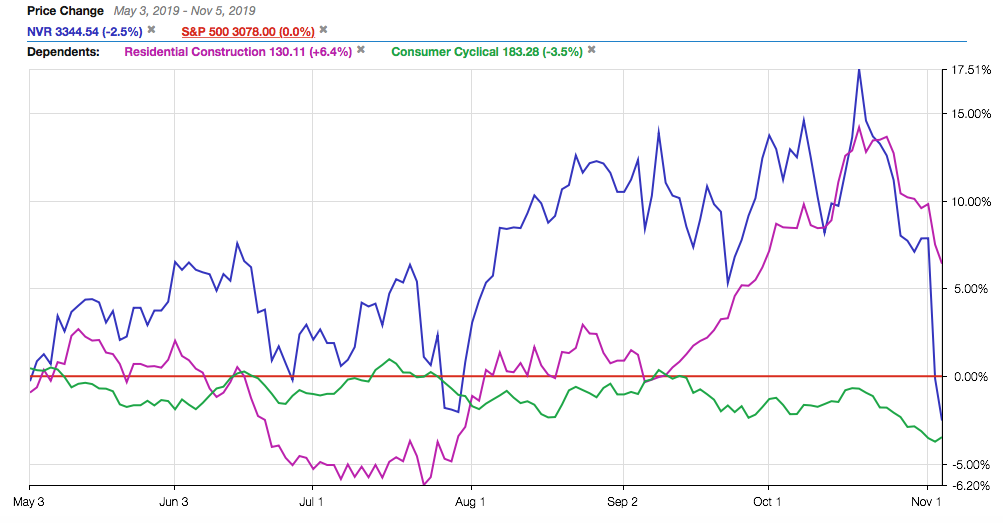
For example, the following relative performance chart shows a stock (in dark blue) that has strongly outperformed its benchmarks: its industry (purple), its sector (green), and the S&P 500 (in red, set as a baseline) over the charted period.

Analyzing a stock is about studying its performance and its business to make a judgment about whether or not it is likely to perform well (better than others) in the future. The comparison above shows the strength the stock has had in the marketplace in the past, which may indicate that it is a well run business that could continue to outperform in the future. However, more research would be needed before making that call.
Fundamentals vs. Technicals
There are two major ways stocks are analyzed: fundamental and technical.
Fundamental analysis assesses the company as a whole—the business in which you are buying equity. Metrics such as earnings, cash flow, business expenses, return on capital, etc., are fundamental metrics. They help you determine the health and profitability of a company. This is important because a strong company is likely to grow. As it does, the value of its stock increases. Fundamental research can help you answer the question: Is this an investment that is likely to grow in value over the long term? All qualitative research is fundamental, and much of your quantitative research will also be fundamental. This guide focuses on fundamental analysis.
Technical analysis, on the other hand, is strictly limited to measures of stock price movement and trading volume. Technical metrics are those that help you identify patterns in stock price and volume, and they have nothing to do with the value of the underlying business. Technicals can help you answer the questions: Is the stock price likely to go up or down in the near future? Is this a good time to make an investment in this stock?
Both fundamental and technical analysis are valuable and they can be used completely independently of each other or blended. Stock Rover and bivio investment clubs both tend to focus on long term investing and therefore place a heavy emphasis on fundamentals. However, we often use technicals to help time our trades and to understand a stock’s current momentum.
If you are brand new to investing, the difference between these two approaches might seem abstract. But as you start to gain experience, the difference between fundamentals and technicals will become more clear and meaningful. As mentioned above, this guide will focus only on fundamentals.
Exercises
Here are a few quick and easy tasks for you to find a stock’s past performance. For step-by-step instructions on finding the information below, please see this appendix.
- Pick a stock, any stock. Determine what industry and sector your stock is in.
- Chart your stock against three benchmarks: its industry, its sector, and the S&P 500 (which can be used as a proxy for the market). How has it performed compared to its benchmarks over different periods, such as 1 month, 1 year, or 5 years?
- As seen in the earlier image, it is possible to set any line as a baseline (a zero line) in Stock Rover to see relative performance. Try it out! Has your stock been an outperformer, an underperformer, or an average performer compared with others in the chart?
Next: A Workflow for Researching Stocks
This guide was created in partnership with bivio, which provides online investment club accounting and hedge fund management services.