The exercises from Chapter VIII on valuation are:
- Find the P/E multiple for a stock you are interested in.
- Compare this multiple to the industry average.
- Chart the P/E for this stock over the last year, and look at the 5-year P/E range.
- Find the forward P/E. Is this higher or lower than the trailing P/E?
- What do you think of the stock’s valuation? Would you buy the company at this price? Why or why not? What price might you consider buying it at?
Here is where you can get the relevant information in Stock Rover.
Find the P/E Multiple
This can be found in “multiple” places.
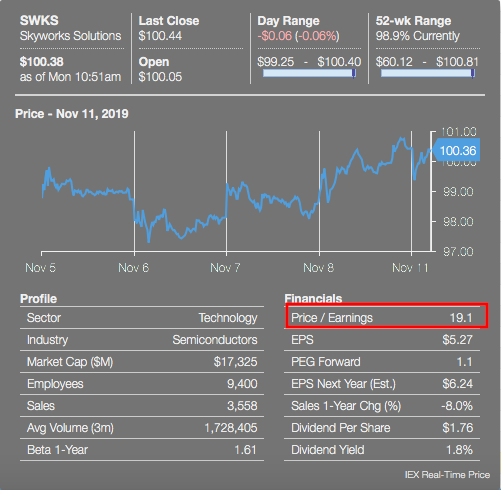
Tooltip: Simply mouse over the ticker symbol to see its tooltip with helpful summary information on the stock. The P/E is called out below.

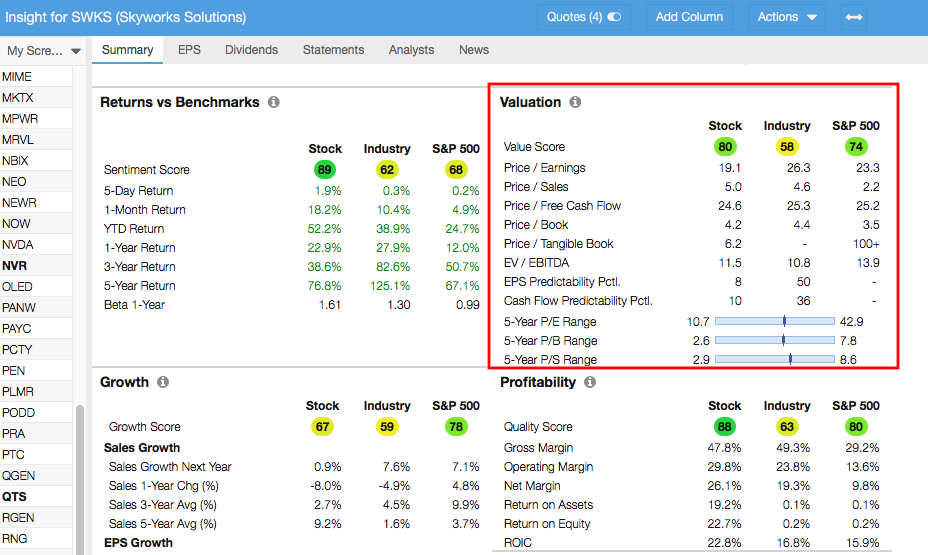
Insight panel, Summary tab: The P/E along with other valuation multiples can be found in the Summary tab of the Insight panel, called out below. Notice also that you can see the averages for the stock’s industry and for the S&P 500.

Find the Industry Average P/E
This information is most easily located in the Summary tab of the Insight panel. See the the above image. Industry averages can also be found in the Summary line at the bottom of the Table when an industry is loaded.
Chart the P/E
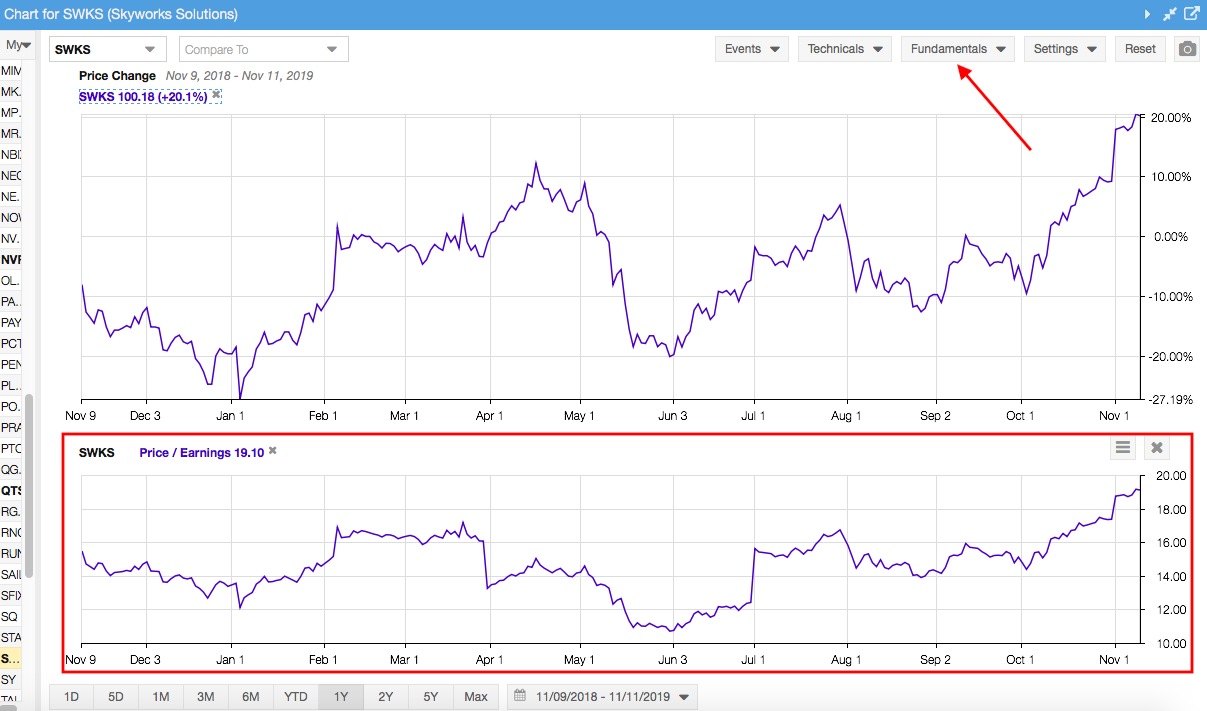
Open the Fundamentals menu in the Chart, pointed out below, and select ‘Price / Earnings.’ The P/E chart will display below the main price chart, as boxed in red below.

Find the 5-year P/E Range
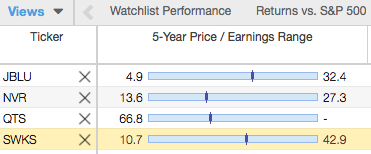
Use the ‘Add Column’ searchbox to find the 5-Year Price / Earnings Range column in an existing view or to add it to your current view. This is a graphical metric shown in the image below that shows you how the current P/E compares with the 5-year historical range of the P/E.

Find the Forward P/E
This is a column in the Table. Find it in the Valuation tab or use the ‘Add Column’ to add it to your view.
For more information on using Stock Rover, see our Help pages or email our Support Team.