The exercises from Chapter VII on profitability are:
- Find the gross margin, operating margin, and net margin for a company in Stock Rover. What sort of trend do you see in the values? Are they increasing or decreasing over the last 5 years? How about over the last 1 year?
- Calculate the current gross margin, operating margin, and net margin using information found on the latest income statement. Check them against the margins you found in #1 – they should be the same (with rounding).
- Compare these margins to those of peer stocks, as well as the industry averages. How does the company compare to peers?
- Read through a recent earnings report from the company. What have they discussed about their sales and expenses that have affected the margins you see on their latest income statement? Do you expect the issues they discuss to improve their margins in the future or to decrease them?
Here is where you can get the relevant information in Stock Rover.
Find the Gross Margin, Operating Margin, and Net Margin
Insight panel, Summary tab: This can quickly be found in the Profitability section of the Summary tab in the Insight panel, shown below.
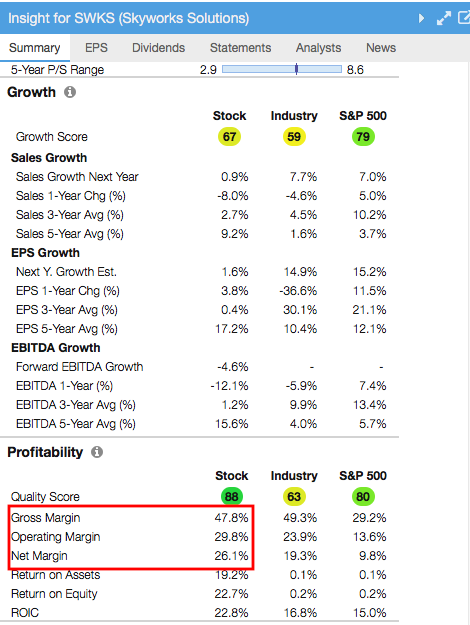
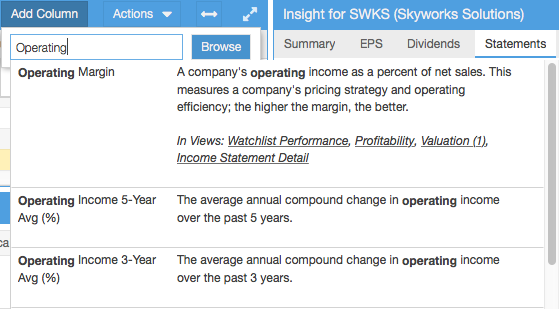
Table: Alternatively, this information can be found in the Table. Use the ‘Add Column’ searchbox to find these columns in an existing view or add them to a current view.
Find the Income Statement
Once you have selected a stock, you will notice that it loads in the table and the Insight panel (on the right hand side of your SR screen). Navigate to the Statements tab and find the income statement among the buttons, as shown below.

Compare to Peer Stocks and Industry Averages
Table: Right click on the ticker of interest and select Show Peers from the ensuing menu. This will automatically load all the industry peers of the selected stock into the table so you can directly compare them to each other. Add the columns you wish (such as gross margin or ROE) using the ‘Add Column’ search box. Once the columns you need are added to the view, you can see how your stock compares to peers.
Sort by a column (by clicking on its column header) in order to see exactly where your stock lands in the mix. You can also use the Summary line at the bottom for industry averages, as shown below.
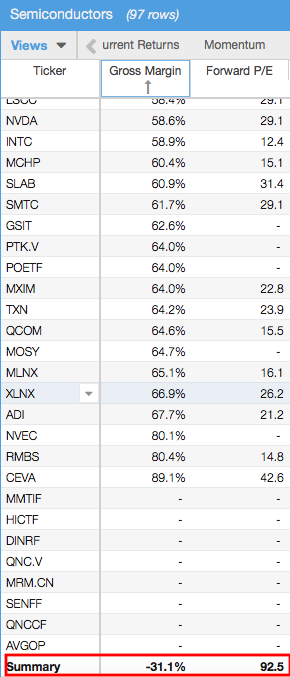
Table: Alternatively, you can load the industry in the main Table using the Navigation tree on the left-hand side of the screen, or by clicking the hyperlinked name in the Industry column, shown in the image below.
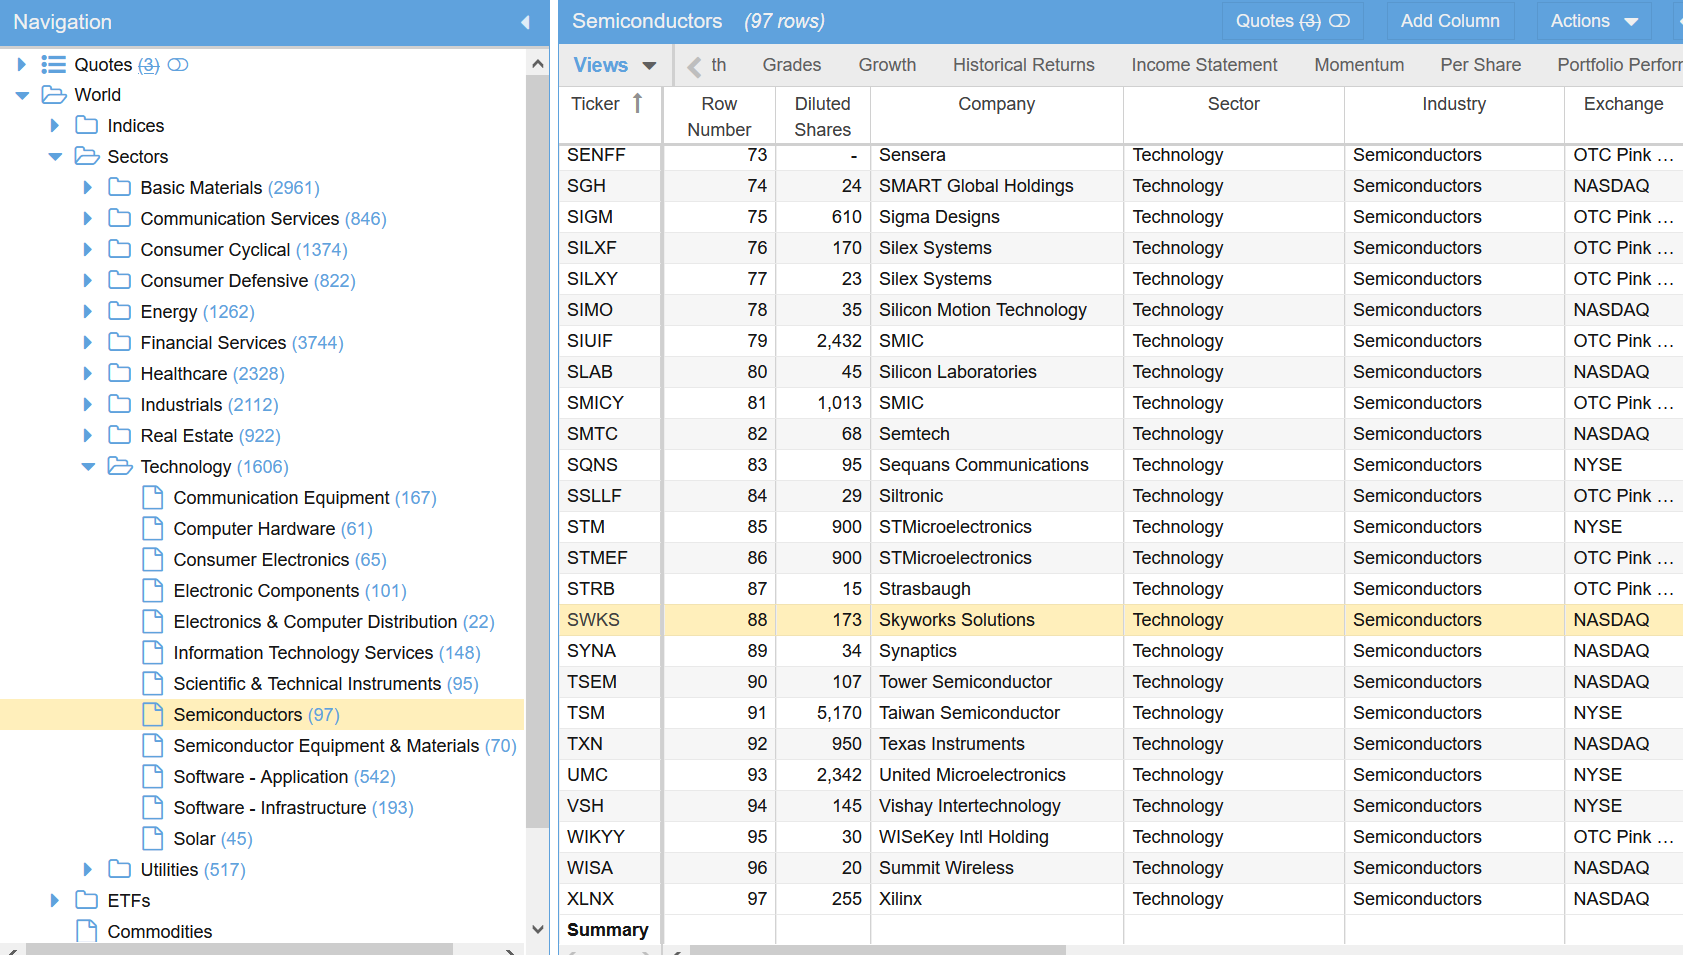
Once the full industry is loaded in the Table, you can compare in any view. As with the Peers tab, you can use the Summary line to see industry averages
Insight panel, Summary tab: For a quick reference on industry gross, operating, and net margins, refer to the Profitability section in the Summary tab of the Insight panel, shown in the first image.
Look at Earnings Report
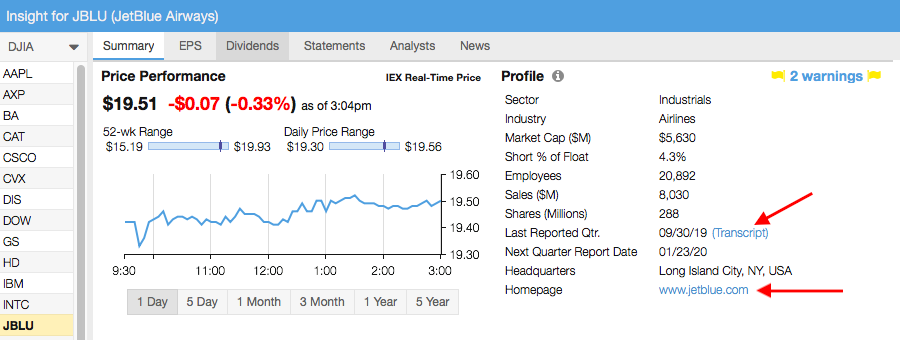
In the Insight panel, Summary tab, you can link to earnings call transcripts and company homepage and SEC Filings under the Statements tab to find the qualitative information that will help answer question 4. See the images below.

For more information on using Stock Rover, see our Help pages or email our Support Team.