In the last chapter, we looked at the balance sheet, which details a company’s financial position at a single point in time. An income statement, by contrast, provides information about a company’s earnings and expenses over a specific accounting period (quarter or year). It tells you how much revenue a company made and how much it spent during that period.
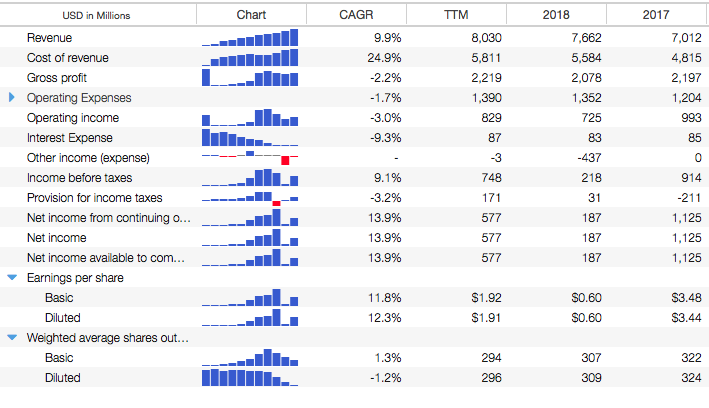
As with the balance sheet, it’s very useful to compare current and historical income statements to identify trends. Below is an example of quarterly income statement information in Stock Rover. The first three lines highlighted with a bracket begin to tell a story about how the company has done during the time period of the report.
You can see that the revenue (AKA sales, often called the “top line”) is increasing each quarter. When you hear about “top line growth,” this is what is being referred to. Growing revenue means a company is attracting more business overall.
In the second line, the cost of revenue, is the direct cost to the company of providing the product or service it sells. In this case, it is also growing, but at a slower rate than the top line. This means the gross profit (third line) is growing quarter over quarter. That is a desirable thing to see. The company is becoming more efficient at providing its products or services and therefore earning more profit each time it makes a sale. The more profitable a company, the more earnings it will have to grow its business and share with you, the shareholder.

Below the top three lines, you see operating expenses and interest expenses. These are costs the company has to run its business that are not directly related to each item it sells. Subtracting these expenses from the gross profit gives net income (called out with a red arrow)—this is the “bottom line,” because it is literally the bottom line of the original income statement, where there is nothing left to subtract.
Net income divided by the number of shares the company has outstanding gives earnings per share (EPS). You can see it also called out in the image with a red arrow. This is a very important metric that is used in measuring a company’s growth and valuation. If you completed the exercises in chapter 3, you have already found the EPS and EPS trend for at least one company. An increasing EPS is generally considered to be the most important indicator that the company is profitable and growing value for its shareholders. In general, you’ll find that stock prices will grow along with growth in earnings per share.
You’ll notice in the income statement that there are two lines for both “basic” and “diluted” EPS. The diluted EPS is a lower, more conservative EPS value because it includes shares that will be issued if stock options, warrants and convertible securities are exercised and become shares outstanding. Investors who prefer a more conservative approach in their research might use this number.
Another thing to look for on the income statement is a manageable interest expense. This relates back to the amount of debt you found on the balance sheet. The company has to pay interest to carry that debt just like you pay interest to carry a house mortgage.
Is the interest expense a large portion of the operating income or does it represent a relatively small cost? If interest is eating up a large portion of operating income, it could indicate that the company is overly leveraged. This means it will have a harder time producing growing earnings. If this is the case, you would also have seen a high debt/equity ratio.
For a list and definitions of other income statement metrics, go here. As an investor, you’ll refer to the information on income statements often. The following exercises will give you some practice.
Exercises:
Get to know the balance sheet with these tasks.
- Find the income statement for the company you are interested in.
- Is revenue increasing consistently? What about gross profit?
- Are revenue (top line) and net income (bottom line) following the same trend? Is one changing faster than the other? If so, what do you think this could mean?
- Compare quarterly and yearly statements. Is the EPS growing year over year (YoY)? Quarter over quarter (QoQ)? Do you notice any seasonal cyclicality within the quarterly EPS trends?
- If your company has long term debt, compare interest expense and operating income. What percentage of the operating income is needed for interest expense? Does this percentage seem manageable? Has it improved over time?
- How does the interest expense compare to the debt/equity ratio?
For instructions on finding the income statement and the other information above in Stock Rover, see this appendix.
Next: Cash Flow Statement
This guide was created in partnership with bivio, which provides online investment club accounting and hedge fund management services.