
Dividend Adjusted Return
Sep 18, 2025 - Sep 18, 2026XLV 168.39 (+24.9%)
S&P 500 7650.50 (+17.5%)



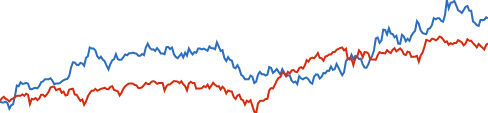



State Street Health Care Select Sector SPDR ETF is a Health ETF with a 0.08% expense ratio and a 1.5% yield. Morningstar rates it 4 of 5 stars; Stock Rover scores it Risk 61, Income 49 (0–100). It holds 62 positions, $43,910M in net assets, a NAV of $168.81.
LLY | Eli Lilly and Co | 14.87% | 5,647,671 |
JNJ | Johnson & Johnson | 10.40% | 17,185,929 |
ABBV | AbbVie Inc | 7.36% | 12,613,791 |
MRK | Merck & Co Inc | 5.93% | 17,632,968 |
UNH | UnitedHealth Group Inc | 5.75% | 6,483,538 |
AMGN | Amgen Inc | 3.77% | 3,853,164 |
TMO | Thermo Fisher Scientific Inc | 3.73% | 2,653,130 |
ABT | Abbott Laboratories | 3.12% | 12,435,437 |
GILD | Gilead Sciences Inc | 2.95% | 8,864,002 |
PFE | Pfizer Inc | 2.64% | 40,690,356 |
| Technology | 0.0% | |
| Financial Services | 0.0% | |
| Healthcare | 100.0% | |
| Consumer Cyclical | 0.0% | |
| Industrials | 0.0% | |
| Communication Services | 0.0% | |
| Consumer Defensive | 0.0% | |
| Energy | 0.0% | |
| Real Estate | 0.0% | |
| Utilities | 0.0% | |
| Basic Materials | 0.0% |
| US Stocks | 99.9% | |
| Cash | 0.1% |
| Value | Blend | Growth | |
| Large | 47.9% | 14.1% | 14.9% |
| Mid | 6.9% | 10.8% | 3.6% |
| Small | 0.4% | 1.3% | 0.2% |
| United States | 100.0% |
| Period | XLV | Category | S&P 500 |
|---|---|---|---|
| 5 Days | +1.8% | +0.9% | +0.2% |
| 1 Month | -0.8% | -1.7% | -0.3% |
| YTD | +9.7% | +9.5% | +12.6% |
| 1 Year | +24.6% | +27.8% | +16.9% |
| 3 Year | +34.2% | +44.8% | +78.1% |
| 5 Year | +37.3% | +26.2% | +84.6% |
| 10 Year | +175.0% | +146.7% | +319.1% |
| Metric | XLV | Category | S&P 500 |
|---|---|---|---|
| Volatility (σ) | |||
| 1 Year | 0.16 | 0.17 | 0.13 |
| 3 Year | 0.14 | 0.16 | 0.15 |
| 5 Year | 0.15 | 0.18 | 0.17 |
| Beta (vs S&P 500) | |||
| 1 Year | 0.28 | 0.52 | — |
| 3 Year | 0.44 | 0.59 | — |
| Sharpe Ratio | |||
| 1 Year | 1.32 | 1.42 | 1.03 |
| 3 Year | 0.40 | 0.49 | 1.13 |
| 5 Year | 0.18 | 0.05 | 0.55 |
| Sortino Ratio | |||
| 3 Year | 0.57 | 0.70 | 1.63 |
| Max Drawdown | |||
| 1 Year | -10.5% | -11.1% | -8.8% |
| 3 Year | -17.1% | -21.2% | -18.7% |
| Capture vs S&P 500 | |||
| 3 Year Upside | 61.7 | 75.1 | — |
| 3 Year Downside | 80.0 | 101.4 | — |
| Downside Deviation | |||
| 3 Year | — | — | — |
| Metric | XLV | Cat Avg |
|---|---|---|
| Costs | ||
| Expense Ratio | 0.08% | 0.81% |
| Turnover Ratio | 2.0% | 46.0% |
| Tracking vs S&P 500 | ||
| Tracking error here is vs the S&P 500 (Morningstar's standard index), not the fund's own benchmark, so sector and bond funds read high even when they track their own index closely. | ||
| 1 Year Tracking Error | 18.0% | 20.2% |
| 3 Year Tracking Error | 14.0% | 16.8% |
| Tracking vs Own Index (Best Fit) | ||
| How closely the fund follows the index it actually tracks. R-squared near 100% and beta near 1.00 indicate tight replication. | ||
| Prospectus Benchmark | S&P 500 (TR) (1970) | |
| Best-Fit Index | Morningstar US Health TR USD | |
| 3 Year R-Squared | 99.3% | |
| 3 Year Beta | 1.00 | |
| 3 Year Alpha | -0.36% | |
| Metric | XLV | Cat Avg |
|---|---|---|
| Tax Efficiency | ||
| 1 Year Tax-Cost Ratio | 0.6% | |
| 3 Year Tax-Cost Ratio | 0.6% | 0.8% |
| 5 Year Tax-Cost Ratio | 0.6% | |
| Market Pricing | ||
| Price / NAV | +99.75% | — |
| NAV | $168.81 | |
| 1 Month Avg Premium/Discount | +0.04% | |
| 1 Year Avg Premium/Discount | +0.00% | -0.01% |
| 1 Year Premium/Discount Range | -0.05% to +0.04% | |
| Liquidity | ||
| 3 Month Avg Dollar Volume | $1.5B | |
| 3 Month Avg Share Volume | 9.0M | |
| Today vs Average | 123.3% | |
| Forward Yield | Forward Rate | TTM Yield | TTM Rate | 5-Yr Avg Regular Yield | SEC 30-Day Yield | Frequency |
| 1.50% | $2.53 | 1.50% | $2.53 | 1.53% | 1.49% | Quarterly |
| 1-Yr | 3-Yr | 5-Yr | 10-Yr | 15-Yr | 20-Yr | |
| 4.1% | 6.5% | 6.4% | 8.7% | 9.4% | 9.3% |
| Ticker | Name | Type | Net Assets | Expense | 1Y Return | 3Y Return | Div Yield | MS Rating | Risk Score | Income Score |
|---|---|---|---|---|---|---|---|---|---|---|
| XLV | ETF | $43,910 | 0.08% | +24.6% | +34.2% | 1.50% | ★★★★☆ | 61 | 49 | |
| IYH | ETF | $3,864 | 0.37% | +24.4% | +33.6% | 1.12% | ★★★★☆ | 53 | 34 | |
| FHLC | ETF | $3,476 | 0.08% | +24.9% | +36.8% | 1.25% | ★★★★☆ | 60 | 49 | |
| SHSKX | Fund | $6,374 | 0.75% | +24.7% | +37.8% | 13.64% | ★★★★☆ | 68 | 70 | |
| THISX | Fund | $12,451 | 0.68% | +32.0% | +43.4% | 10.83% | ★★★★☆ | 55 | 76 | |
| HGHFX | Fund | $806 | 0.94% | +28.0% | +33.3% | — | ★★★☆☆ | 40 | 59 | |
| SWHFX | Fund | $654 | 0.80% | +17.1% | +26.5% | 5.23% | ★★★☆☆ | 45 | 71 | |
| IHI | ETF | $3,474 | 0.37% | -14.1% | +4.3% | 0.51% | ★★☆☆☆ | 10 | 29 | |
| FTXH | ETF | $1,054 | 0.60% | +47.2% | +63.0% | 1.03% | ★★★★★ | 76 | 43 | |
| PGHAX | Fund | $1,541 | 0.70% | +18.2% | +30.8% | 1.77% | ★★★★☆ | 49 | 46 | |
| FSMEX | Fund | $3,347 | 0.62% | +12.0% | +25.3% | — | ★★★☆☆ | 14 | 5 | |
| FSHCX | Fund | $852 | 0.67% | +13.4% | +4.2% | 0.70% | ★★☆☆☆ | 19 | 45 | |
| JFNNX | Fund | $6,034 | 0.68% | +32.0% | +49.9% | 4.27% | ★★★★☆ | 68 | 61 | |
| IHE | ETF | $1,662 | 0.37% | +45.9% | +72.8% | 1.41% | ★★★★☆ | 87 | 43 | |
| GGHSX | Fund | $1,242 | 0.72% | +14.7% | +32.8% | — | ★★★☆☆ | 56 | 26 |
XLV has underperformed its category average by 3.2% over the past year.